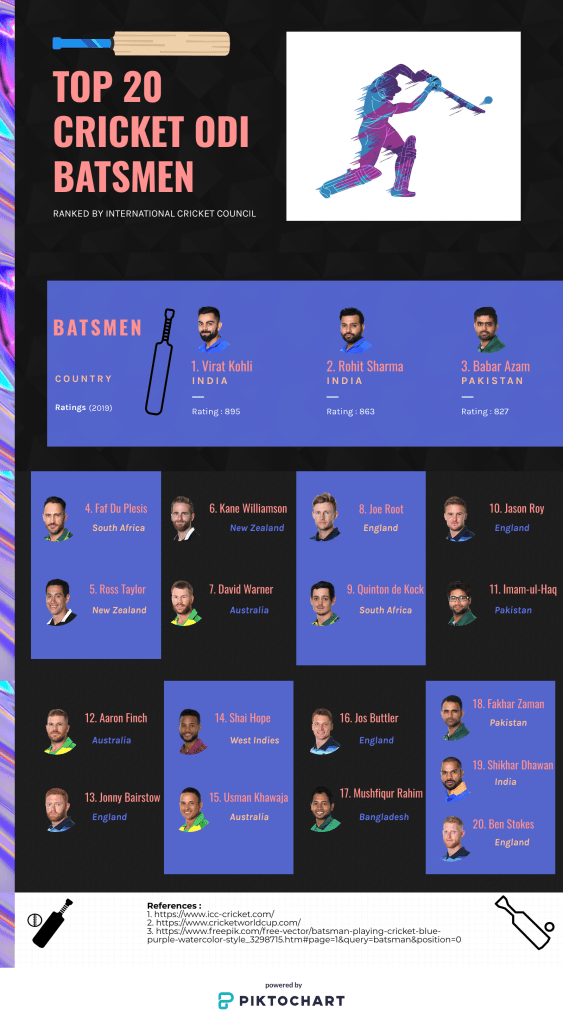
The first thing was to select a topic which was easy for me. At a glance, I got an idea that selecting “Cricket” as a theme would be a great idea. And I made an infographic on “Top 20 Cricket ODI Batsmen”. The next step was to work on research i.e. what to include or exclude in an infographic. And, to select the colors combinations based on my theme. The infographic should look clear and the viewer could be able to easily scan at a glance that what it is about. Also, to use some graphic icons in the infographic is good idea because it’s looks clear and creative at a time. As the reader is scanning, he/she should get an idea that what story infographic is trying to say. The process also includes that using more than 3 colors in it looks vague and irritative for eyes to see. The infographic should look attractive to the viewer. If any references used, it must be mentioned at the end of the infographic. This is the process of creating an infographic.
